Fundamental diagram of traffic flow
The relation between flow and density, density and speed, speed and flow, can be represented with the help of some curves. They are referred to as the fundamental diagrams of traffic flow. They will be explained in detail one by one below.
1. Speed-flow diagram

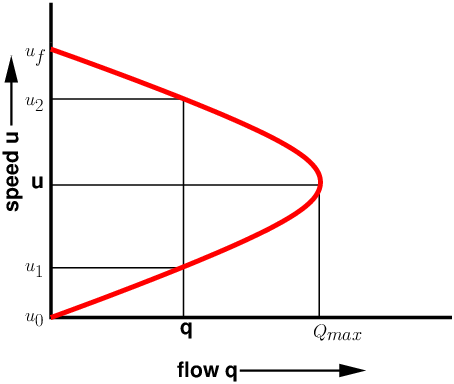
- Fig. shows the relationship between speed and flow. The speed corresponding to maximum flow capacity (Qmax) is called optimum speed. If speed is more or less than optimum, the flow value decrease.
- The speed flow curve indicate the level of service. When flow is maximum (Qmax), all the vehicles travel at an optimum speed and overtaking is not possible. In this situation, the level of service considered as poor.
- When the flow (Q) is less than optimum, all the vehicles can travel at their convenient speed and overtaking can be done easily. In this condition, the level of service is high.
2. Flow-density curve
The flow and density varies with time and location. The relation between the density and the corresponding flow on a given stretch of road is referred to as one of the fundamental diagram of traffic flow. Some characteristics of an ideal flow-density relationship is listed below:
- When the density is zero, flow will also be zero,since there is no vehicles on the road.
- When the number of vehicles gradually increases the density as well as flow increases.
- When more and more vehicles are added, it reaches a situation where vehicles can’t move. This is referred to as the jam density or the maximum density. At jam density, flow will be zero because the vehicles are not moving.
- There will be some density between zero density and jam density, when the flow is maximum. The relationship is normally represented by a parabolic curve as shown in figure.

3. Speed-density diagram
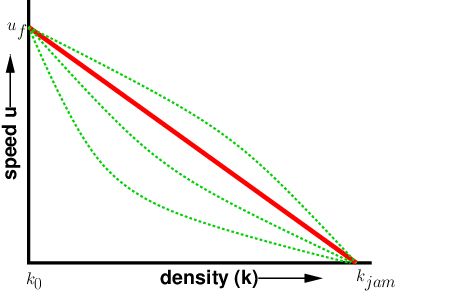
- Similar to the flow-density relationship, speed will be maximum, referred to as the free flow speed, and when the density is maximum, the speed will be zero.
- The most simple assumption is that this variation of speed with density is linear as shown by the solid line in figure below.
- Corresponding to the zero density, vehicles will be flowing with their desire speed, or free flow speed. When the density is jam density, the speed of the vehicles becomes zero.
- It is also possible to have non-linear relationships as shown by the dotted lines.

4. Combined diagrams
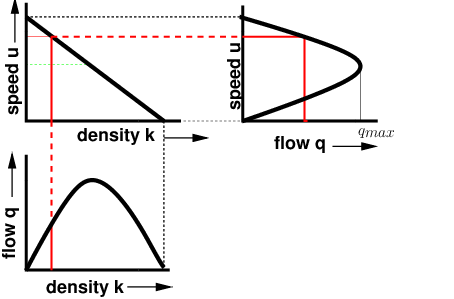
The inter-relationship between speed-flow, speed-density, and flow-density are shown below.

