Level of service
- Highway Capacity Manual (HCM) used travel speed and volume by capacity ratio (v/c ratio) to distinguish between various levels of service.
- The value of v/c ratio can vary between 0 and 1.
- Depending upon the travel speed and v/c ratio, HCM has defined six levels of service, level A to level F based on a graph between operating speed and v/c ratio as shown in the figure.
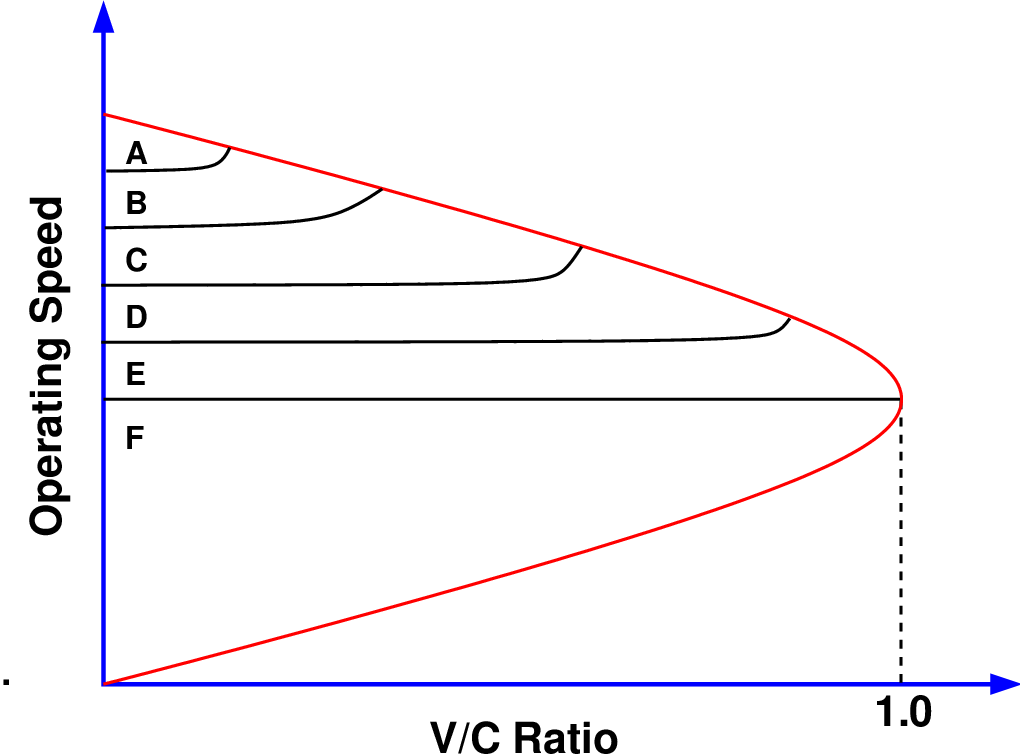
The operating conditions for the six levels of service selected by HCM are given below (Level A represents the highest and level F the lowest) :
| LOS | Quality | Speed (kmph) | V/C | Description |
| A | Free-flow | 80 | 0.6 | High level of physical and psychological comfort |
| B | Reasonable free-flow | 70 | 0.7 | Reasonable level of physical and psychological comfort |
| C | Near free-flow | 60 | 0.8 | Local deterioration possible with blockages |
| D | Medium flow | 50 | 0.85 | Non-recoverable local disruptions |
| E | At capacity flow | 40 | 0.9 | Minor disturbances resulting breakdown |
| F | Congested flow | 15 | 1.0 | Break down of flow capacity drops |
(A) Free Flow Traffic
Users are practically unaffected by the presence of other vehicles on a road section. The choice of speed and the maneuverability are free. The level of comfort is excellent, as drivers need minimal attention. The volume-to-capacity ratio is usually below 0.2.
(B) Steady Traffic
The presence of other vehicles begins to affect the behavior of individual drivers. The choice of the speed is free, but the maneuverability has somewhat decreased. The comfort is excellent, as drivers simply need to keep an eye on nearby vehicles.
(C) Steady Traffic but Limited
The presence of other vehicles affects drivers. The choice of the speed is affected and maneuvering requires vigilance. The level of comfort decreases quickly at this level, because drivers have a growing impression of being caught between other vehicles.
(D) Steady Traffic at High Density
The speed and the maneuverability are severely reduced. Low level of comfort for drivers, as collisions with other vehicles, must constantly be avoided. A slight increase in the traffic risks causing some operational problems and saturating the network.
(E) Traffic at Saturation
Low but uniform speed. Maneuverability is possible only under constraint for another vehicle. Users are in a state of frustration.
(F) Congestion
Unstable speed with the formation of waiting lines at several points. Cycles of stop and departure with no apparent pattern because created by the behavior of other drivers. A high level of vigilance is required for the user with practically no comfort. At this level, the volume-to-capacity ratio exceeds 1, implying that the road segment is used above design capacity.